# Objective

Turns out, Tracy dep (in)compatibilities can be a headache. Here was my
experience following the [Profiling Tracy
documentation](1525dff7ad/docs/profiling.md (tracy-profiler)):

I ran into this error when I attempted to connect to my bevy client:

<img width="473" height="154" alt="Screenshot 2025-07-13 at 14 39 27"
src="https://github.com/user-attachments/assets/97634b37-253c-40ab-86ca-6eba02985638"
/>

Attempting to find where the version incompatibility stemmed, I found
these tracy dep versions and a link to the compatibility table in the
source:

1525dff7ad/crates/bevy_log/Cargo.toml (L32-L35)

This led me to believe I needed Tracy `0.11.1`, to match the
`tracy-client` version `0.18.0`.

This was confusing because `0.11.1` is the version I already had
installed (by running `brew install tracy`), and latest Tracy version
currently available on `brew`.

It turned out that Cargo was eagerly pulling `tracy-client` `0.18.2`
instead of `0.18.0`, making the Tracy version I needed actually
`0.12.2`. At the time of writing, `0.12.2` is not published on `brew`.

## Solution

I've pinned the Tracy deps, and mentioned in the comment which Tracy
version Bevy is compatible with.

I've also added some notes to [Profiling Tracy
documentation](1525dff7ad/docs/profiling.md (tracy-profiler))
to explain
- How to determine which Tracy version to install
- That MacOS users may need to compile from source if the required Tracy
version is not available on `brew`.

## Testing

- Did you test these changes? If so, how?
I ran Tracy locally.

- Are there any parts that need more testing?
I don't think so.

- How can other people (reviewers) test your changes? Is there anything
specific they need to know?
Follow instructions to run Tracy

- If relevant, what platforms did you test these changes on, and are
there any important ones you can't test?
Tested MacOS. I think change should be OS agnostic.
# Objective

- Using Xcode can be confusing to setup for rust projects.

# Solution

- Add instructions to docs/profiling.md for how to use start debugging a
bevy project with Xcode's GPU debugging/profiling tools.
# Objective

- Make it easier to understand how to profile things.
- Talk about CPU vs GPU work for graphics.

## Solution

- Add a section on GPU profiling and CPU vs GPU work.
- Rearrange some sections so Tracy is the first backend mentioned.

## Issues
I did this as a very quick fix to clear some things up, but the overall
guide still flows poorly and has too much extraneous info distracting
from the use case of "I just want to figure out why my app is slow",
where the advice should be "use tracy, and if GPU bottlenecked, do
this". Someone should do a full rewrite at some point.

I chose to omit talking about RenderDiagnosticsPlugin, but it's
definitely worth a mention as a way to easily check GPU + GPU time for
graphics work, although it's not hooked up in a lot of the engine, iirc
only shadows and the main passes. Again someone else should write about
it in the future.

Similarly it might've been useful to have a section describing how to
use NSight/RGP/IGA/Xcode for GPU profiling, as they're far from
intuitive tools.
## Explanation

I got kind of lost on this earlier (the Tracy docs are not very helpful)
and required some assistance, so I thought it might be helpful to add
this somewhere in the profiling docs. The way it's presently inserted is
kind of awkward, but I don't know enough about the other operating
systems to make similar sections for them, which I think would be
helpful, since it's going to be different on each one.

---------

Co-authored-by: Jerome Humbert <djeedai@gmail.com>
Co-authored-by: Alice Cecile <alice.i.cecile@gmail.com>
Co-authored-by: Jan Hohenheim <jan@hohenheim.ch>
# Objective

Document how to use Tracy memory profiling.

Fixes https://github.com/bevyengine/bevy/issues/8417.

## Solution

Expand Tracy documentation in profiling.md.

## Testing

New documentation tested manually; no code changes made.
# Objective

#11331 move the tracy dependency, this remove the line number to avoid
keeping the link in sync

---------

Co-authored-by: Alice Cecile <alice.i.cecile@gmail.com>
# Objective

- Standardize fmt for toml files

## Solution

- Add [taplo](https://taplo.tamasfe.dev/) to CI (check for fmt and diff
for toml files), for context taplo is used by the most popular extension
in VScode [Even Better
TOML](https://marketplace.visualstudio.com/items?itemName=tamasfe.even-better-toml
- Add contribution section to explain toml fmt with taplo.

Now to pass CI you need to run `taplo fmt --option indent_string=" "` or
if you use vscode have the `Even Better TOML` extension with 4 spaces
for indent

---------

Co-authored-by: Alice Cecile <alice.i.cecile@gmail.com>
# Objective

While pointing someone to the profiling doc, I saw a source link and
thought "hm, I wonder if that link is up-to-date?"

After clicking on it, I realized that it wasn't even attempting to point
to the right line -- probably a good idea since that would be super
prone to breakage.

However, the system being referenced is pub and the docs are on docs.rs,
so we can just link there. This gets the content straight onto the
user's screen.

## Solution

Change source link to docs link

## Note

This is slightly awkward in that the profiling docs themselves aren't
rendered anywhere and just live in the repo. It does feel more correct
to link to in-repo code on the same branch.
# Objective

Links to `cargo-flamegraph`'s repo point to a [fork](https://github.com/killercup/cargo-flamegraph), not the actual upstream repo. We should point to the source of truth instead of a fork that hasn't been updated since 2019.

## Solution

Change links to point to the upstream repo at  [flamegraph-rs/flamegraph](https://github.com/flamegraph-rs/flamegraph).
# Objective

- Document how to do profiling with Tracy

# Solution

- The documentation of setting `RUST_LOG=info` in order to capture `wgpu` spans depends on https://github.com/bevyengine/bevy/pull/5182
Tracing added support for "inline span entering", which cuts down on a lot of complexity:
```rust
let span = info_span!("my_span").entered();
```
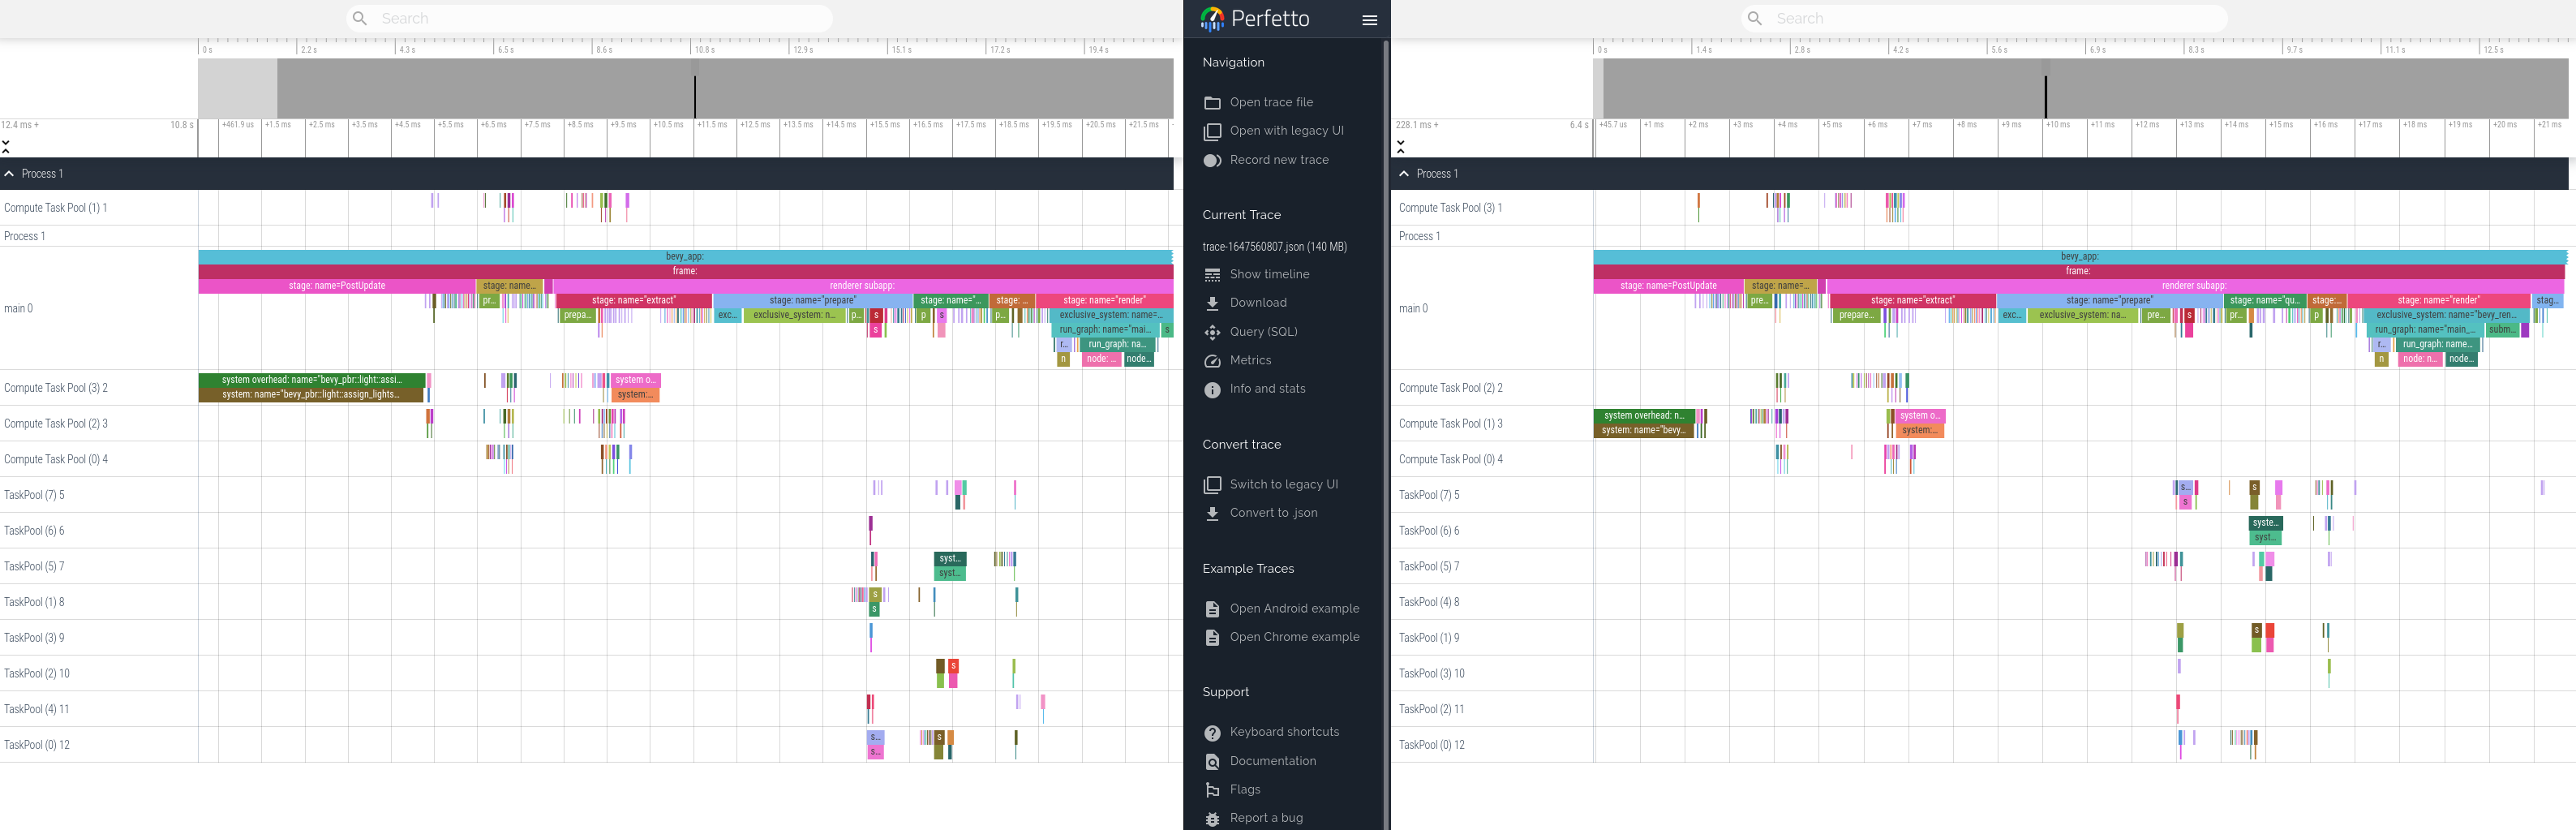
This adapts our code to use this pattern where possible, and updates our docs to recommend it.
This produces equivalent tracing behavior. Here is a side by side profile of "before" and "after" these changes.
Features must be called with the crate, otherwise the following error is thrown:

> error: none of the selected packages contains these features: trace_chrome
# Objective

- It isn't very useful to be able to enable feature `trace_chrome` on its own

## Solution

- Enable `trace` feature when enabling `trace_chrome` or `trace_tracy`


Co-authored-by: François <8672791+mockersf@users.noreply.github.com>
I just updated profiling.md (and accidentally skipped the pr process by not checking "create new branch" in the github ui). The markdown wasn't properly formatted, which broke the build.