I just updated profiling.md (and accidentally skipped the pr process by not checking "create new branch" in the github ui). The markdown wasn't properly formatted, which broke the build.
49 lines
3.0 KiB
Markdown
49 lines
3.0 KiB
Markdown
# Profiling
|
|
|
|
## Runtime Flame Graph: `tracing` spans
|
|
|
|
Bevy has built-in [tracing](https://github.com/tokio-rs/tracing) spans to make it cheap and easy to profile Bevy ECS systems, render logic, engine iternals, and user app code. Enable the `trace` cargo feature to enable Bevy's built-in spans. You also need to select a `tracing` backend using the following cargo features:
|
|
|
|
### Backend: trace_chrome
|
|
|
|
`cargo run --release --features trace,trace_chrome`
|
|
|
|
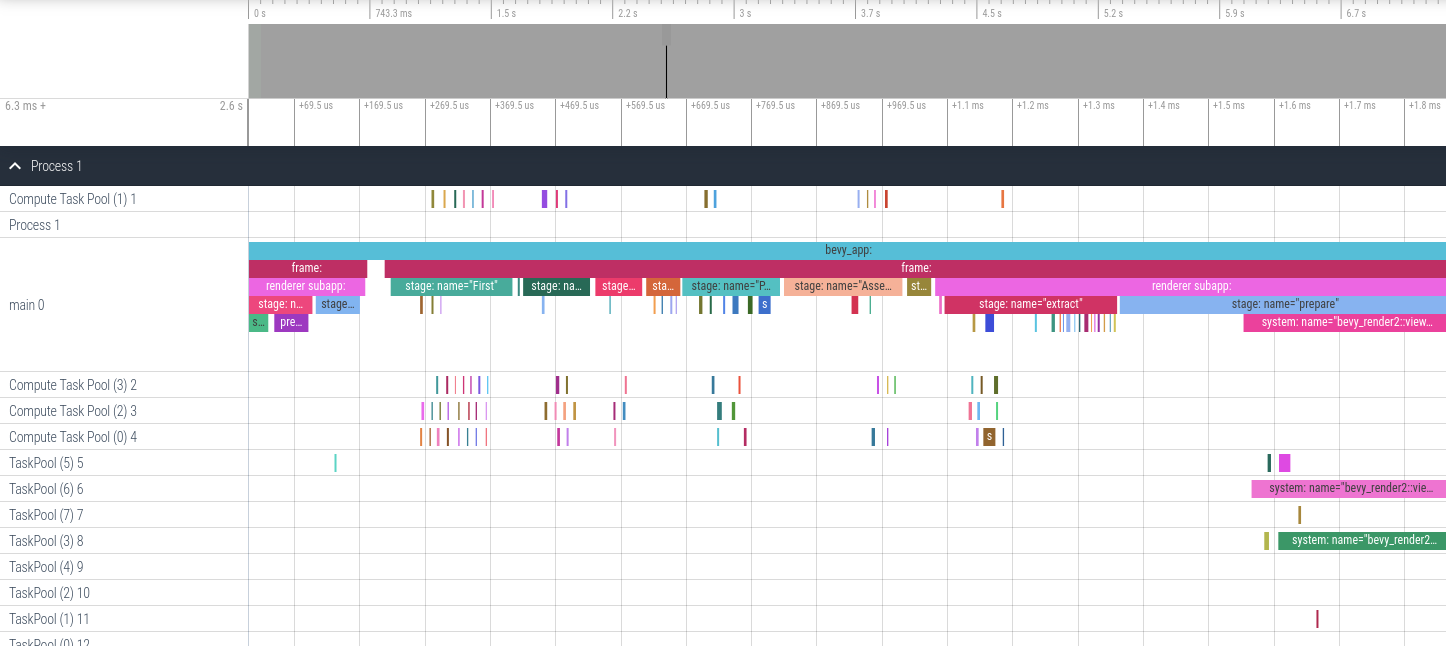
After running your app a `json` file in the "chrome tracing format" will be produced. You can open this file in your browser using <https://ui.perfetto.dev>. It will look something like this (make sure you expand `Process 1`):
|
|
|
|
|
|
|
|
### Adding your own spans
|
|
|
|
Add spans to your app like this (these are in `bevy::prelude::*` and `bevy::log::*`, just like the normal logging macros).
|
|
|
|
```rust
|
|
|
|
let my_span = info_span!("span_name", name = "span_name");
|
|
{
|
|
// starts the span's timer
|
|
let guard = my_span.enter();
|
|
} // guard is dropped here ... this stops the timer
|
|
```
|
|
|
|
Search for `info_span!` in this repo for some real-world examples.
|
|
|
|
For more details, check out the [tracing span docs](https://docs.rs/tracing/*/tracing/span/index.html).
|
|
|
|
## `perf` Runtime Flame Graph
|
|
|
|
This approach requires no extra instrumentation and shows finer-grained flame graphs of actual code call trees. This is useful when you want to identify the specific function of a "hot spot". The downside is that it has higher overhead, so your app will run slower than it normally does.
|
|
|
|
Install [cargo-flamegraph](https://github.com/killercup/cargo-flamegraph), [enable debug symbols in your release build](https://github.com/killercup/cargo-flamegraph#improving-output-when-running-with---release), then run your app using one of the following commands. Note that `cargo-flamegraph` forwards arguments to cargo. You should treat the `cargo-flamegraph` command as a replacement for `cargo run --release`. The commands below include `--example EXAMPLE_NAME` to illustrate, but you can remove those arguments in favor of whatever you use to run your app:
|
|
|
|
* Graph-Like Flame Graph: ```RUSTFLAGS='-C force-frame-pointers=y' cargo flamegraph -c "record -g" --example EXAMPLE_NAME```
|
|
* Flat-ish Flame Graph: ```RUSTFLAGS='-C force-frame-pointers=y' cargo flamegraph --example EXAMPLE_NAME```
|
|
|
|
After closing your app, an interactive `svg` file will be produced:
|
|
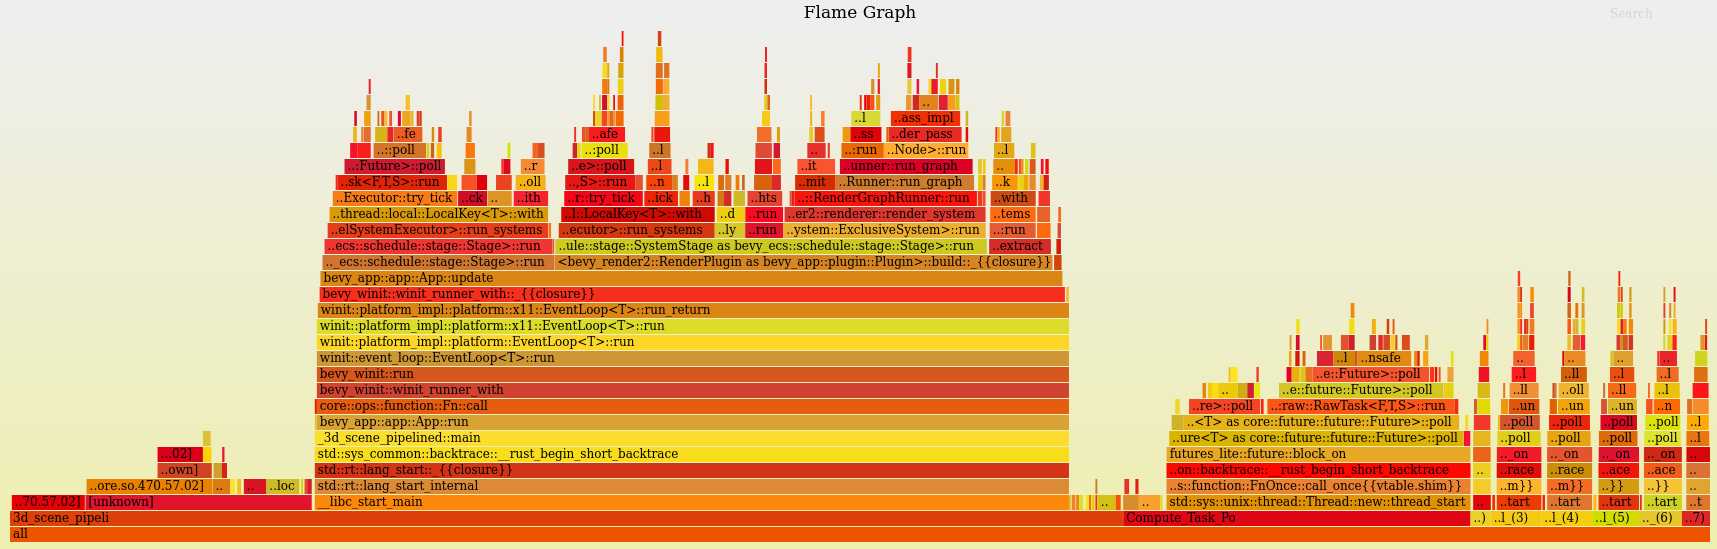
|
|
|
|
## Project Compile Times
|
|
|
|
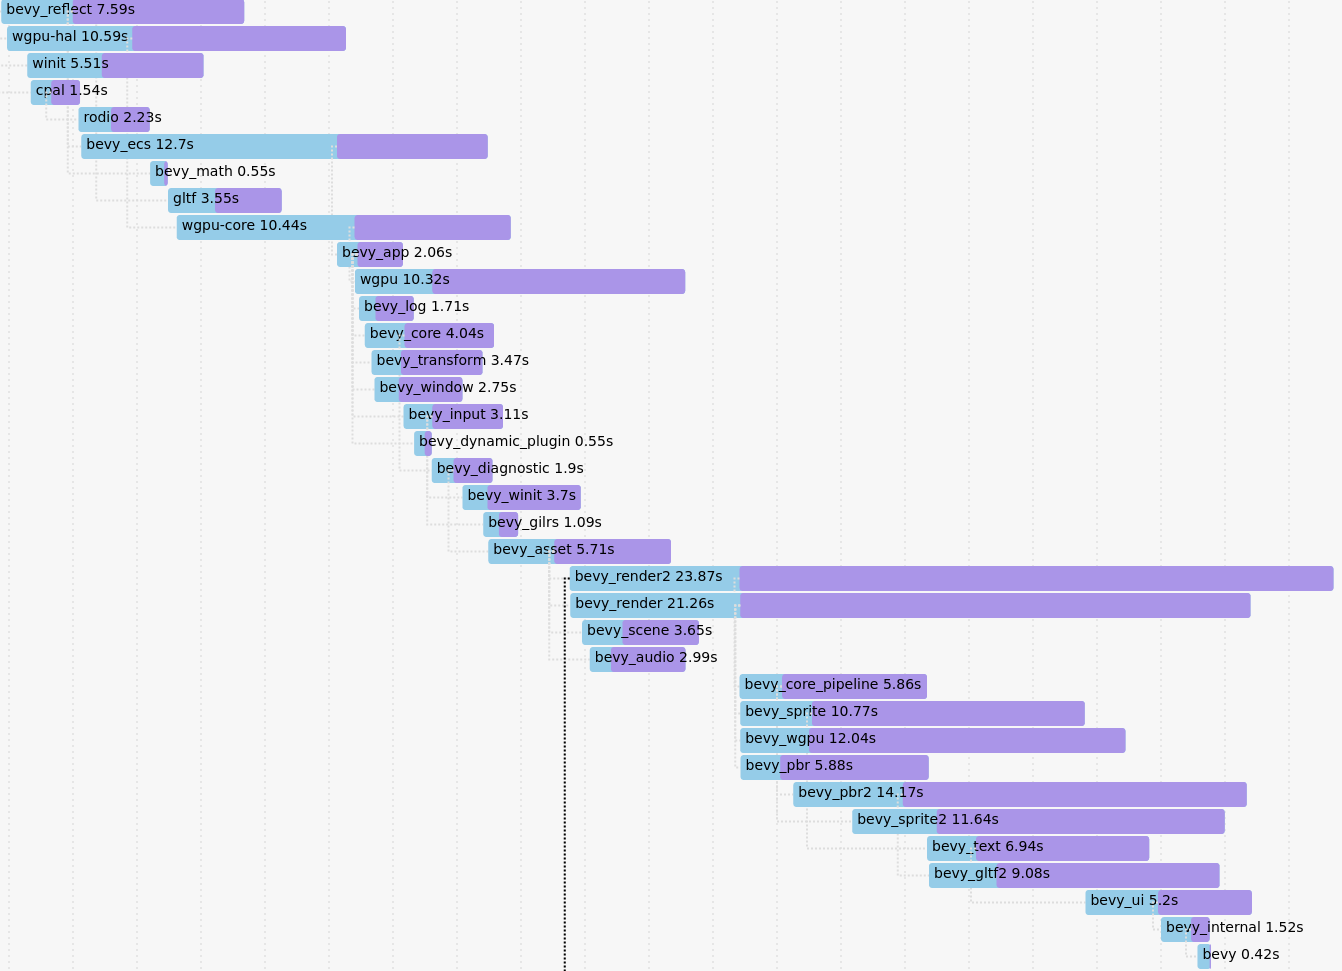
This requires nightly rust (`rustup default nightly`). Append ```-Ztimings``` to your app's cargo command (ex: `cargo build -Ztimings`). If you want a "full" profile, make sure you run `cargo clean` first. Open the produced `cargo-timing.html` file in your browser of choice. This will show how much time each crate in your app's dependency tree took to build.
|
|
|
|
|